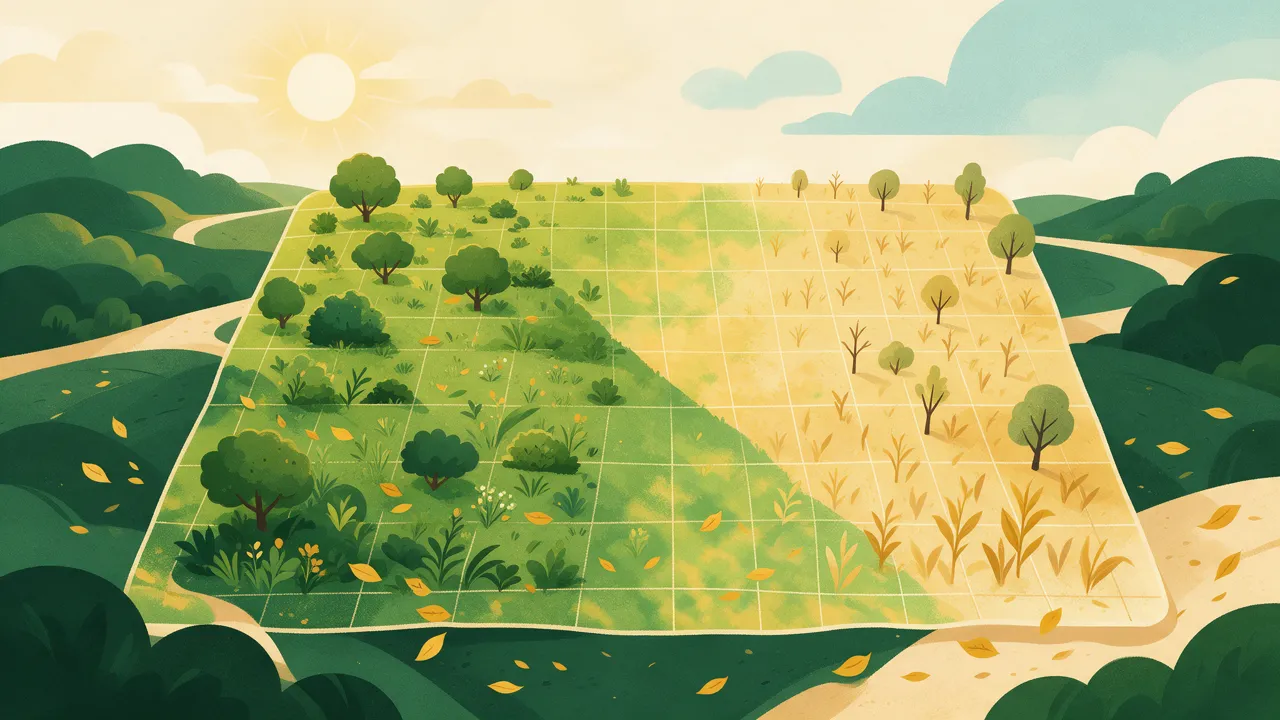
NDVI is the best-known acronym in digital farming — and one of the most misunderstood. Healthy vegetation absorbs red light and reflects near-infrared; NDVI compares the two and yields a number from −1 to +1.
What it is genuinely good for
Differences within a field (a persistently low patch tells you where to go and look), comparing a field against its own past seasons, and checking whether an intervention worked.
When it misleads
It saturates over dense canopies, cannot tell crop from weed, and single cloudy frames can be artifacts. NDRE handles dense canopies better, NDMI tracks water stress early, and Landsat thermal data reveals persistently hot patches.
Indices are symptoms, not diagnoses: the satellite shows where, you check what on the ground. In Zemedelko the monitoring comes bundled with soil analysis and an AI reading of what the differences likely mean.