SATELLITE SOIL ANALYSIS
Soil analysis from orbit
Management zones and estimates of humus, nitrogen, phosphorus, potassium and pH — from the 11-year satellite archive of your field, no probe, no lab queue. The report is ready within the hour.
10 m
point resolution
11 yr
satellite archive
< 1 hour
to a ready report
€0.19
per decare
How it works
Outline your field
On the map or by cadastral parcel number — one click.
The archive is scanned
Hundreds of Sentinel-2 frames since 2015; the models pick the bare-soil ones.
The model reads the spectrum
Humus, N, P, K and pH are estimated on a 10-metre grid with models calibrated to the European LUCAS laboratory base.
You get the report
Management zones, values with agronomic classes, a VRA file and a plain-language AI reading.
Real maps from a real report
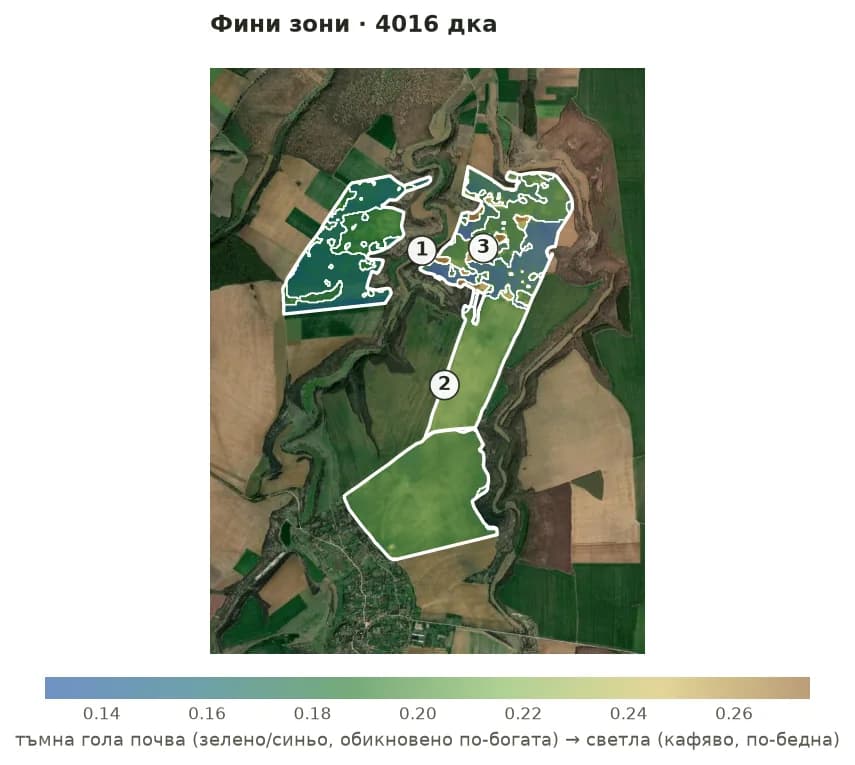
Management zones
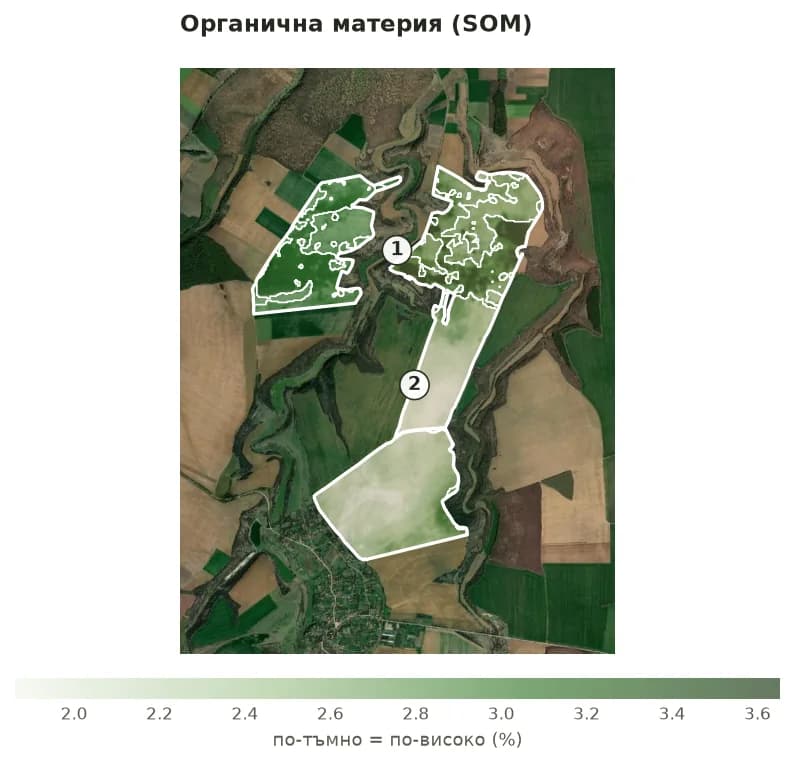
Organic matter (SOM)
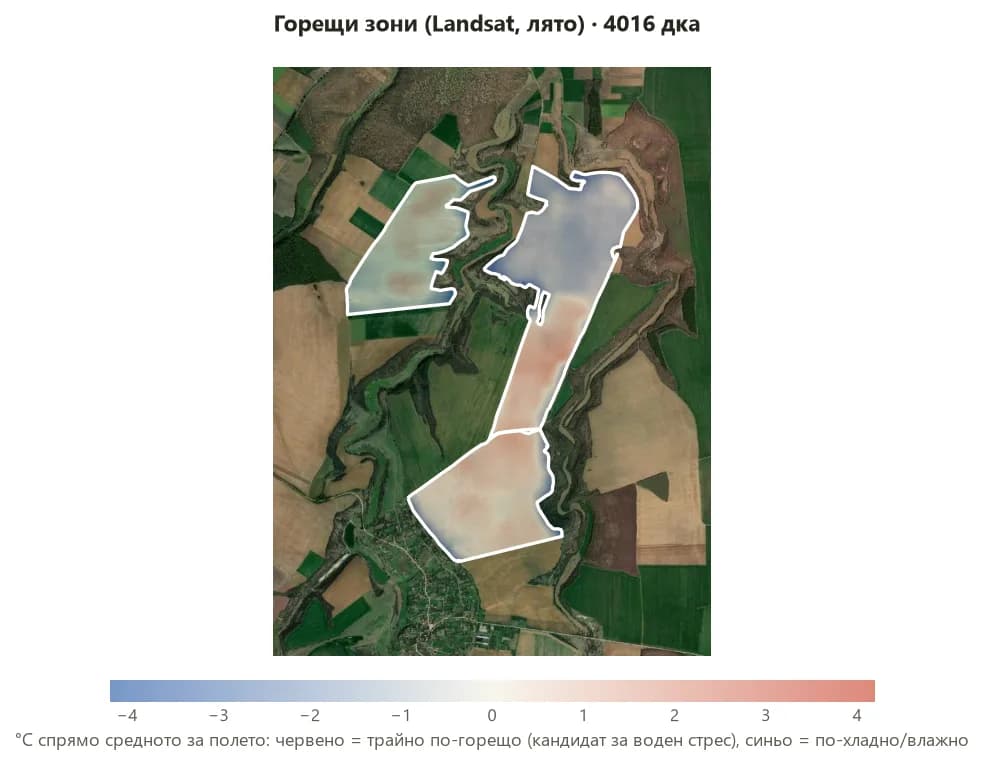
Thermal hot zones (Landsat)
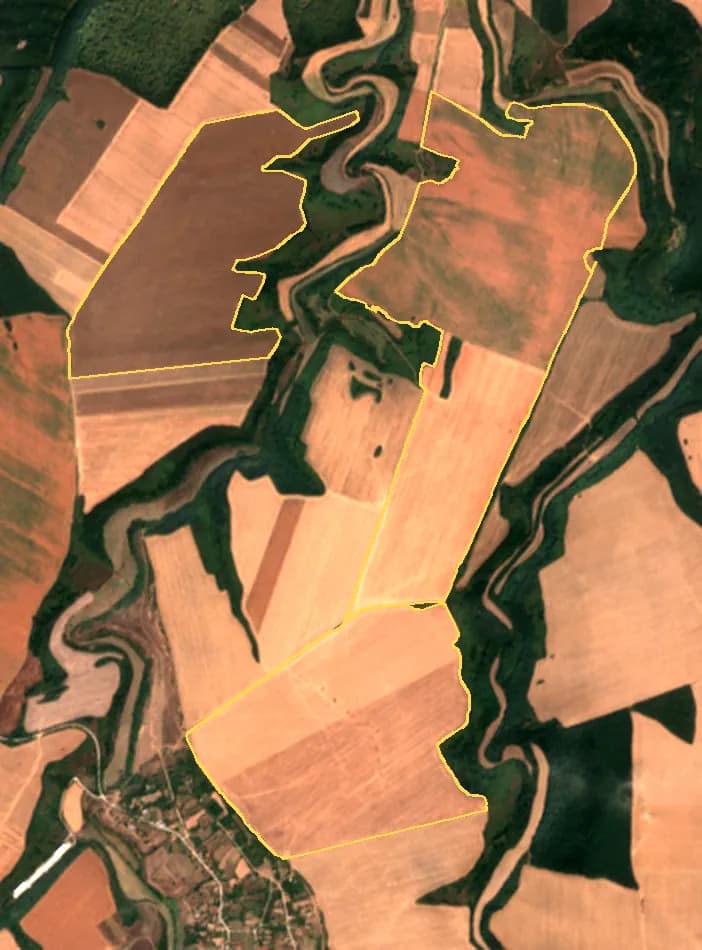
Satellite frame
What the report contains
- ✓Management zones — areas of similar soil, with size and share of the field
- ✓Zone estimates: humus (SOM), N, P, K, pH — value, agronomic class and uncertainty interval
- ✓A ready VRA file for variable-rate fertilisation
- ✓Time slider: how the field looked in each of the last 11 years
- ✓Thermal profile (Landsat): persistently hot zones revealing water stress
- ✓Guidance on where to take 2–3 control lab samples — and calibration with their results
- ✓An AI reading: what the numbers mean and what to do, in plain language
Accuracy — no varnish
Satellite analysis is a model, not a measurement. Every report publishes its accuracy: cross-validated R² and error per indicator, and an uncertainty interval for every value. Zones are the most robust output; absolute values are refined with 2–3 control samples the analysis calibrates against. It does not replace the lab — it tells you where sampling makes sense and how to distribute fertilisation.
Price
€0.19/decare
minimum order €9.90
🎁 During the test period: the first analysis of a field up to 500 decares is free — no card, no commitment.
Over 10,000 decares — contact us for an individual offer.
First analysis is freeThe maths vs a classic campaign (example: 50 ha)
Laboratory campaign
10–15 samples × €8–15 + fieldwork and waiting
≈ €150–250, weeks
Satellite analysis
whole field, 10 m grid, zones + VRA + AI reading
€95, under an hour
The sensible combo
satellite zones + 2–3 control samples for calibration
≈ €130, days
Frequent questions
How accurate is it?
Accuracy is published in every report (R², cross-validation, intervals). Zones are the most reliable output; absolute values calibrate with control samples.
Does it work for small fields?
Yes — billed per decare with a minimum order under €10; a 5 ha report is the same as a 500 ha one.
Do I need special machinery?
No. The report reads in the browser; the VRA file is a bonus for terminals that read maps.
Try it on your own field
Outline the field and see the report within the hour. The first analysis of a field up to 500 decares is free.
First analysis is free