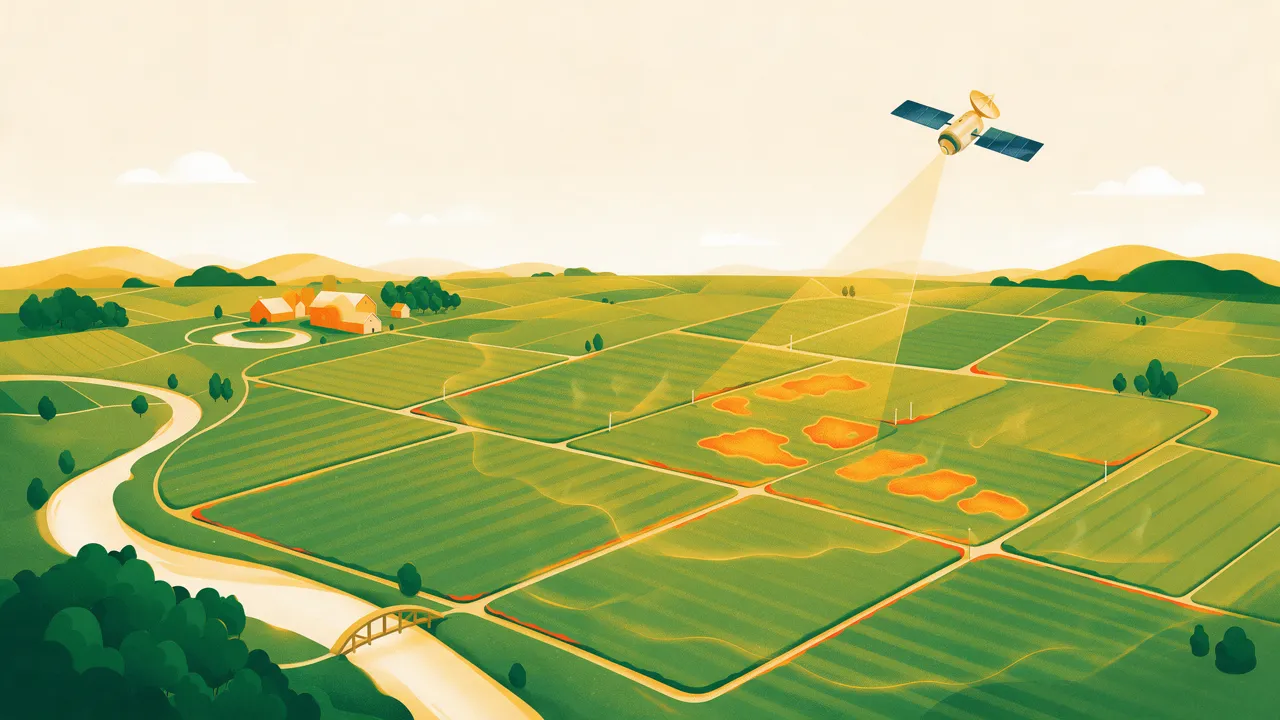
Vegetation indices look at how green a field is; thermal data looks deeper — at how effectively the plants cool themselves. A well-watered crop transpires and stays cooler; when water stops (drought, compaction, damaged roots), the patch warms up days before visible wilting. Landsat 8/9 measure this at 30 m with a decades-long archive.
The signal is in persistence: a patch running 1.5–2 °C above the field average summer after summer almost always has a soil cause — and usually matches a distinct zone in the soil analysis. In Zemedelko's report the thermal profile sits next to the zones, with an AI reading of what it likely means.